
We’ve got a new paper out, based on some work done at MAGPIE shortly before I left. Instead of using the full one million amps to drive something using MAGPIE, we used a smaller pulsed-power device to produce a plume of plasma using a ‘plasma gun’.
James MacDonald is a PhD student in Simon Bland’s group, in the lab just down the corridor, and he’s been studying these plasma guns for his thesis. He was able to get lots of nice measurements using a fibre-optic-based time-resolved two-colour triature interferometer (try saying that when you’re drunk or in a viva) and he was interested to see whether we could make any measurements of the temperature using our Thomson scattering diagnostic.
A plasma gun is much less sexy than it sounds. At heart, it’s a simple piece of rigid coaxial cable – a copper conductor on the inside, a couple of mm across, then a Teflon dielectric insulator, then a copper outer conductor. The entire thing is just 6 mm across, or about a quarter of an inch. The workshop cut a cone into the end of it, so the inner conductor doesn’t extend as far as the outer conductor. And then we hook up a small capacitor charged to a few tens of thousands of volts, and discharge the capacitor through the cable.
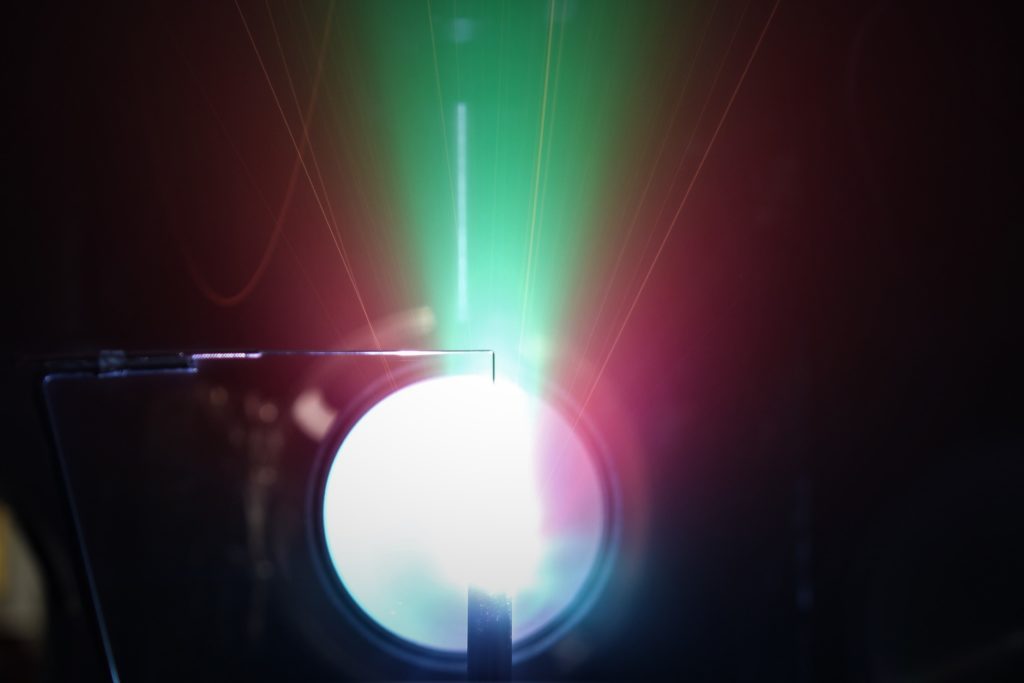
Initially the dielectric resists the high voltage between the inner and out conductor. And by initially, I mean for a few billionths of a second. Then electrons liberated by the high voltage stream across the dielectric surface, crashing into it, liberating other electrons and forming a plasma. Before you know it, there’s current flowing, plasma ablating from the dielectric surface and you’ve launched a plume of plasma from your “gun”. This is unlikely to become a weapon any time soon – the total energy in the jet is very low and we have to fire it in a vacuum chamber for it to work. If you can convince your enemy to stand in a vacuum chamber it may be slightly easier just to suffocate them. It is, however, rather pretty (see image above).
Why are plasma guns interesting? Well, in some ways they are not. They have niche uses in pre-filling a volume with plasma for certain types of x-ray diode. But for me they are interesting because they don’t blow up. You can fire the plasma gun every ten minutes, and you don’t have to open the vacuum chamber to replace anything. Compared to MAGPIE, where it can take three days to build the load and then it is utterly destroyed, this offers a nice chance to actually get a lot of data, very quickly. In fact all the data for this paper was taken in two days, and I only used the results from a single shot!
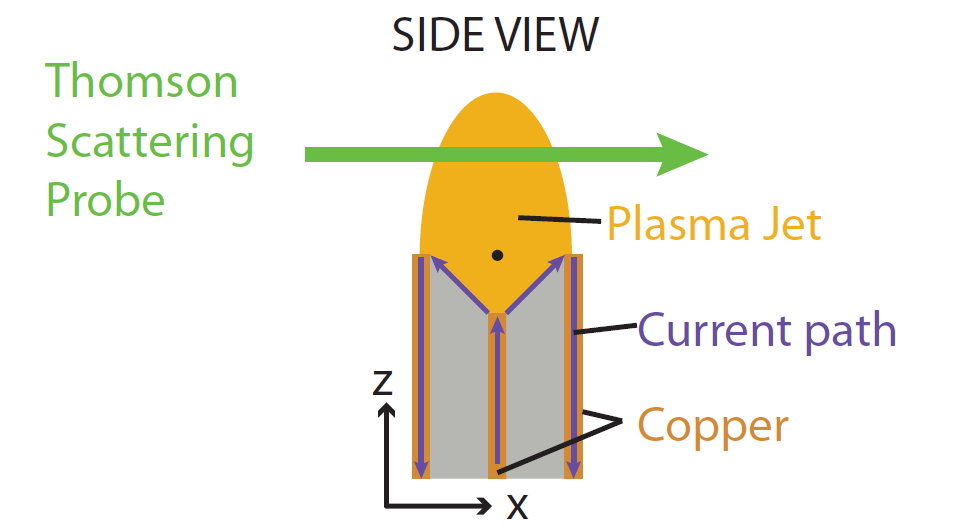
On MAGPIE we’ve spent a while developing a rather nice diagnostic suite for measuring various plasma properties like electron density, magnetic field, electron and ion temperatures, bulk flow velocities and the like. So we wheeled in James’ plasma gun, bolted it to the vacuum chamber and got the Thomson scattering system up and running. We’d never actually measured temperature this low with our system before, so we decided to hook up a new spectrometer and look at the so-called ‘electron feature’ of the spectrum.
Thomson scattering in a nut-shell: electrons move. Hot electrons move faster. Electrons reflect laser light (okay, technically they “scatter” it) and the reflected light has a slightly different frequency than the incoming light. This is exactly the same effect that makes ambulance sirens change pitch as the ambulance drives past you. By measuring the frequency of the reflected light we can determine how fast the electrons were moving, and hence their temperature.
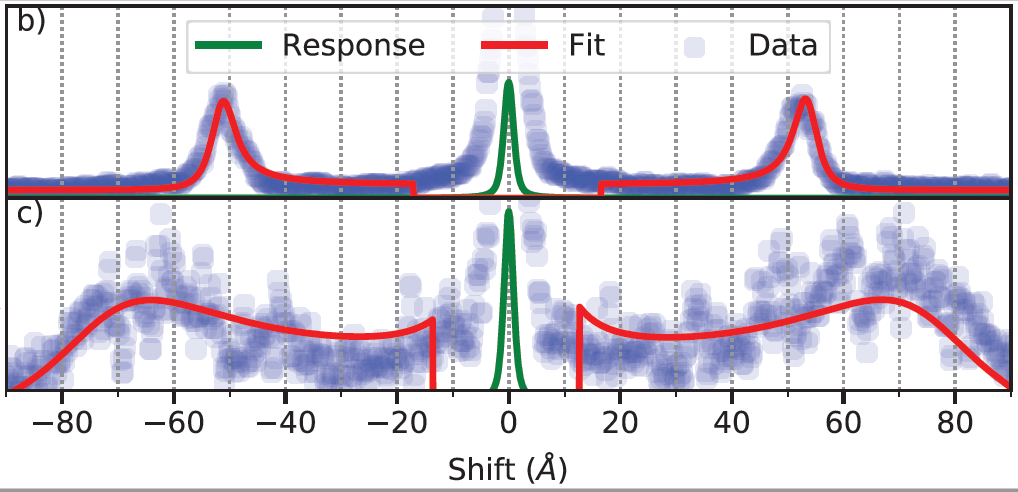
Unsurprisingly, it’s a bit more complicated than that. Under some conditions, the electrons act together – this is called collective motion. Imagine a still pond. The water is made up water molecules, all moving randomly. Chuck a stone in and ripples form. These ripples are a collective motion of all the water molecules. In the same way, we can sometimes measure the collective “ripples” or “modes” of the electrons, which can give us more information. Even more excitingly, sometimes we can measure both types of behaviour – the random “non-collective” motion and the ordered “collective” motion – at the same time. That’s exactly what we did in this paper, and it yielded some interesting results.
Our paper is basically a series of cautionary tales. There are some established techniques which are often taken for granted, especially on larger experiments where there can be a disconnect between the person setting up the experiment, the person taking the data and the person analysing it. The same problem can happen on smaller experiments where knowledge is passed on by word of mouth, and analysis codes written by post-docs long past are treated as black boxes of wisdom. This leads to blindly trusting the output of data analysis codes without fully understanding their limitations.
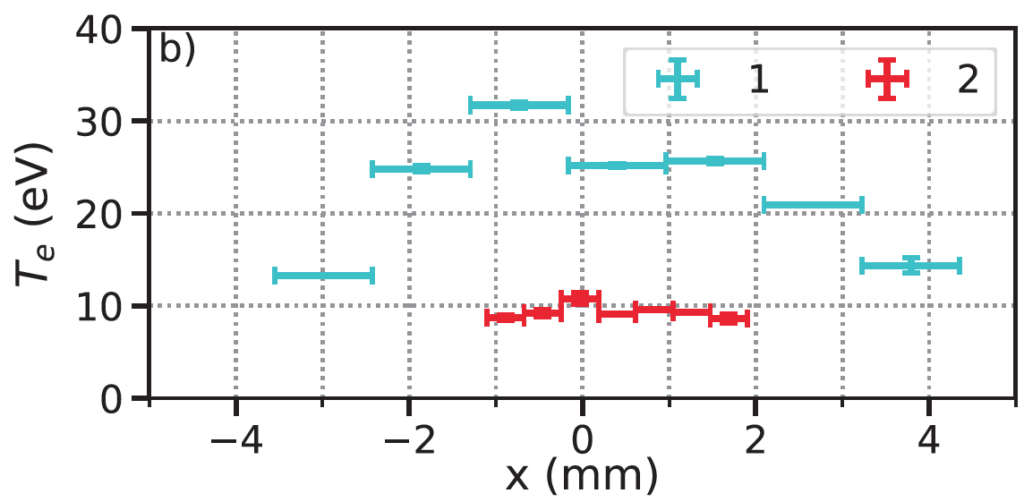
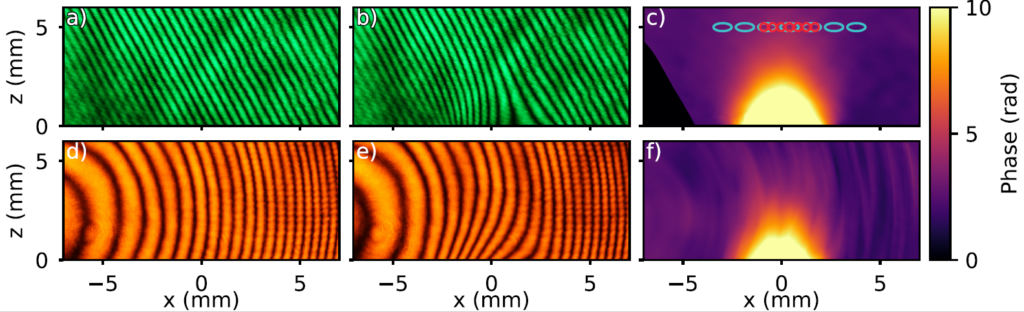
We found that we got very different answers from the various diagnostics we used, and only by putting these results together and carefully considering the various sources of error were we able to get a (more) consistent picture. If we had taken a result from one diagnostic, these subtle effects would not have been noticeable, and we would have happily quoted temperature of 30 eV (see graph above) rather than the more plausible 10 eV. At the same time, we made the first direct measurements of the temperature inside a plasma gun plume – maybe not worthy of a Nobel prize, but still useful to those who indulge in such things.
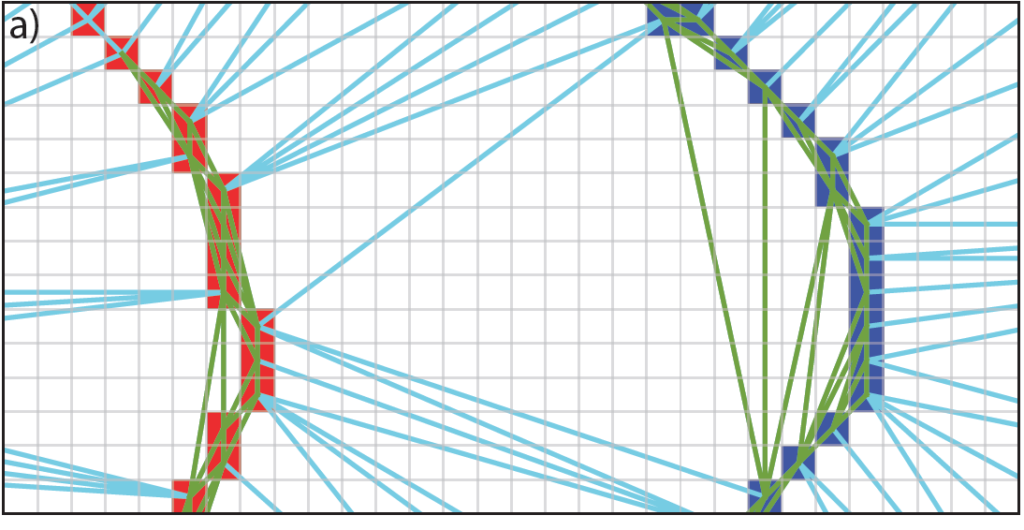
The paper also has an appendix a rather nice section on our interferometry analysis code, which was updated last summer by Jakub Dranczewski, an undergraduate at Imperial College. The code takes interferometry images that have already been traced (a tedious task by hand or a slightly infuriating one using a computer) and interpolates the values of the phase between the light and dark interference fringes. This can then be used to make very beautiful images of the electron density inside the plasma plume, like those shown earlier in this blog post.
So that’s my last lead author paper from MAGPIE for the foreseeable future. There’s still a lot of stuff I’ve worked on that will hopefully be published soon by others in the group, and I’m looking forward to reading those papers as well. For now though, back to work for ITER!