The premier plasma physics event of the year, the American Physical Society’s Division of Plasma Physics Annual Meeting is now upon us. Normally this would mean jet lag, hoppy American beers, AirBnBs in dodgy parts of town and far too much cheap conference coffee. This year, thanks to the pandemic, I will have to make do with a kind of jetlag (the sessions often finish at midnight), too much screen time and plentiful cups of tea.
It was a struggle to develop any enthusiasm for this conference in its virtual form – one of the best parts of a conference is meeting people in person, catching up with old friends or forming new collaborations. Still, last week I finally sat down to prepare my talk. The abstract I had submitted back in July was hopelessly optimistic, but I started throwing some slides together in an attempt to make something coherent.
And this is where it got interesting. I was trying to tell a story about a turbulent plasma which we had produced and diagnosed more than three years ago, in a series of experiments in 2016 and 2017. The post doc leading those experiments had long since moved onto pastures new, but the results were so tantalising that the data nagged at the back of our minds. Over the summer, we wrote up an article on the new diagnostic we’d developed, an Imaging Refractometer (https://arxiv.org/abs/2007.04682), but there was still data from Faraday Rotation Imaging and Thomson Scattering sitting on my hard drive, untouched.
I knew that to make a decent talk I would have to include this data, but it had been months since I have done any data analysis, having been entirely focused on writing grants and trying to get my visa sorted ready for my move to the US. I reluctantly fired up a copy of the Jupyter notebook which contains my Thomson scattering analysis code, and started to mangle the data into a usable form.
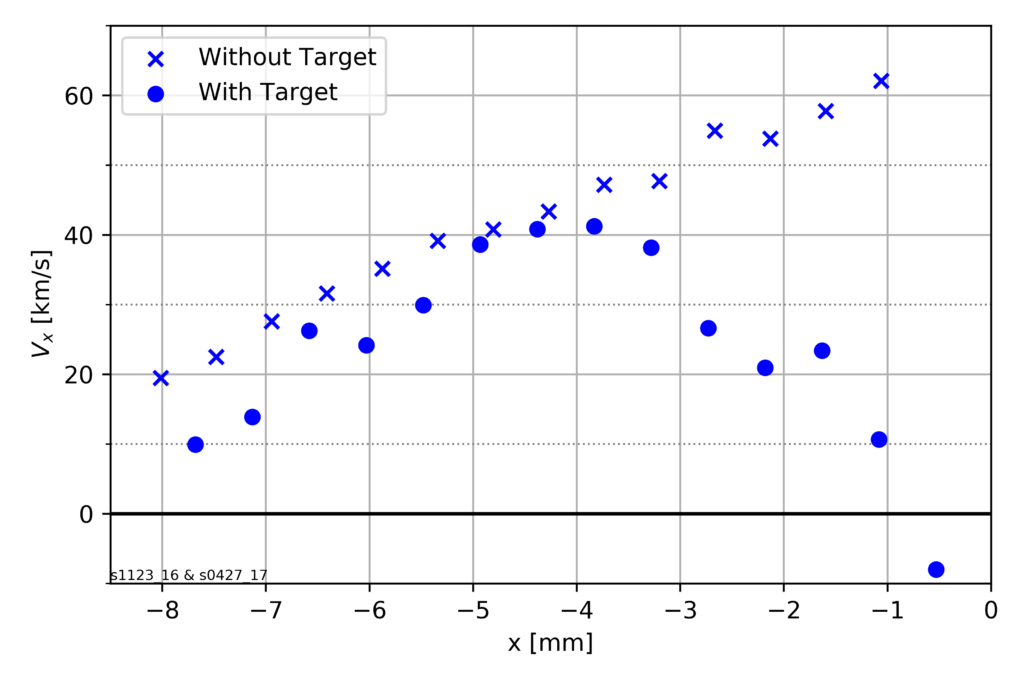
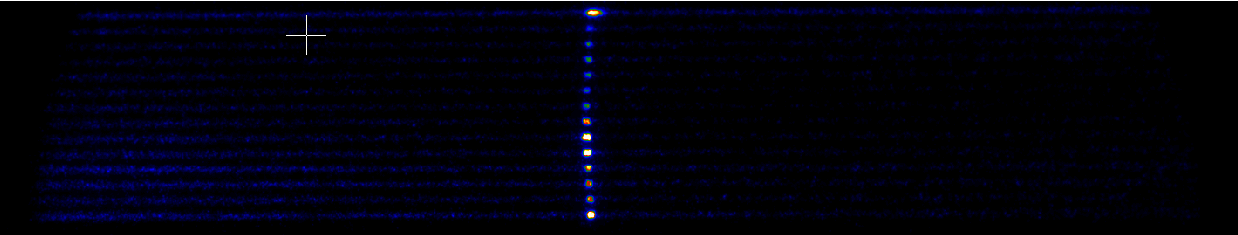
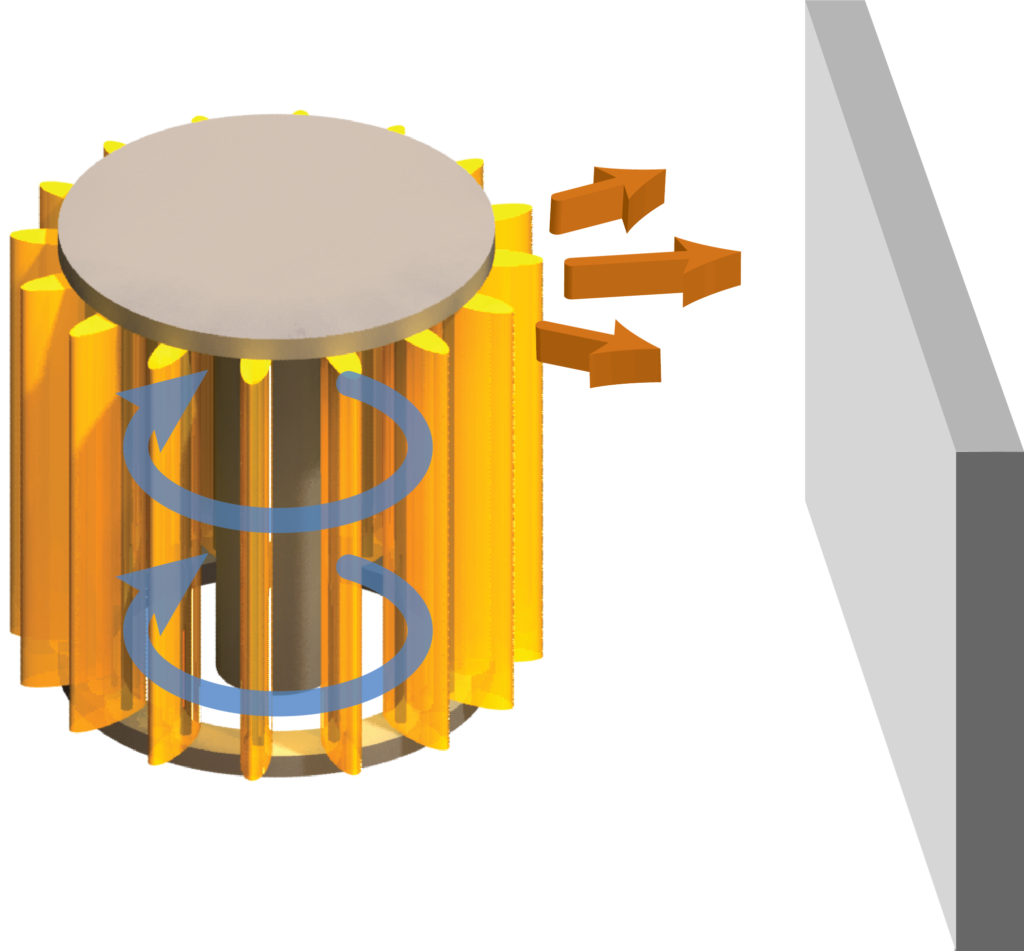
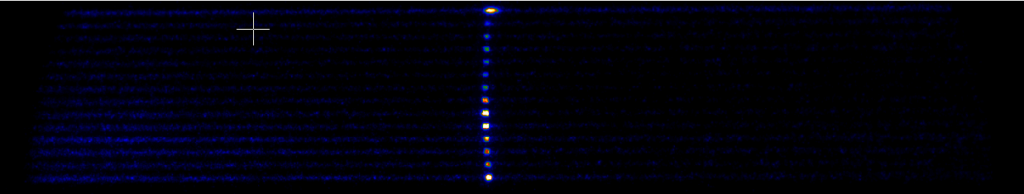
The raw data already told a pretty interesting story – the plasma flow accelerates away from the exploding wire array, but then the flow enters a region of turbulence, and begins to decelerate. We also had data from an experiment with no target, so we could see that in that case, the flows just accelerate away from the wire array. So we know that this turbulence is responsible for the deceleration, and we could also observe the signal getting broader.
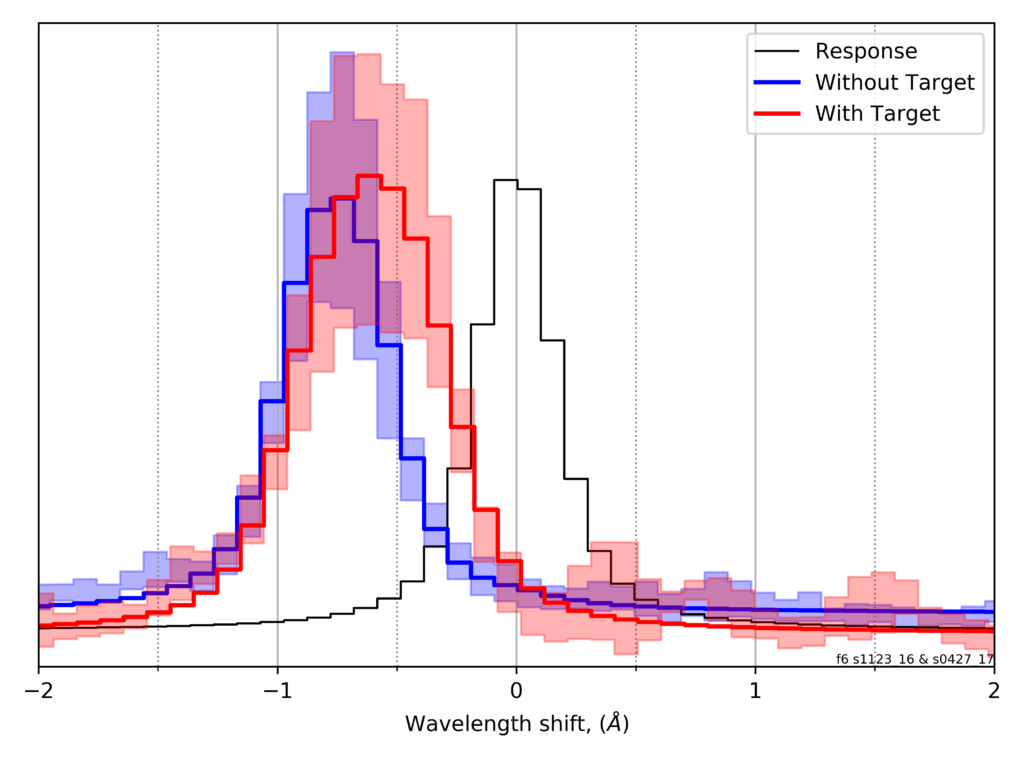
It’s unclear whether this is the real temperature of the plasma, or if the broadening is caused by a range of velocities caused by sheared flow or turbulence. One thing we can say is that for any reasonable parameter range, our plasma is highly collisional – the distribution functions are close to Maxwellian, and so it’s unlikely any interesting kinetic effects are present.
With this extra data, the talk now makes some sort of sense, though there are many open questions. If you want to know more, my talk is on Wednesday, and I’ll post a link to a recording afterwards.